Quickstart
It only takes a few minutes to launch a standalone or clustered database on SkySQL. You can pick from about 30 global regions and launch on AWS or GCP.
You have three choices to provision a DB on SkySQL :
This Quickstart explains how to launch database services and manage the lifecycle of database services using the Portal in a web browser.
For users who prefer other interfaces, SkySQL offers the following alternatives:
- Use the SkySQL web Portal. Make your choices with a few clicks and hit Launch.
- Use the DBaaS API with a REST client
- Use the Terraform provider
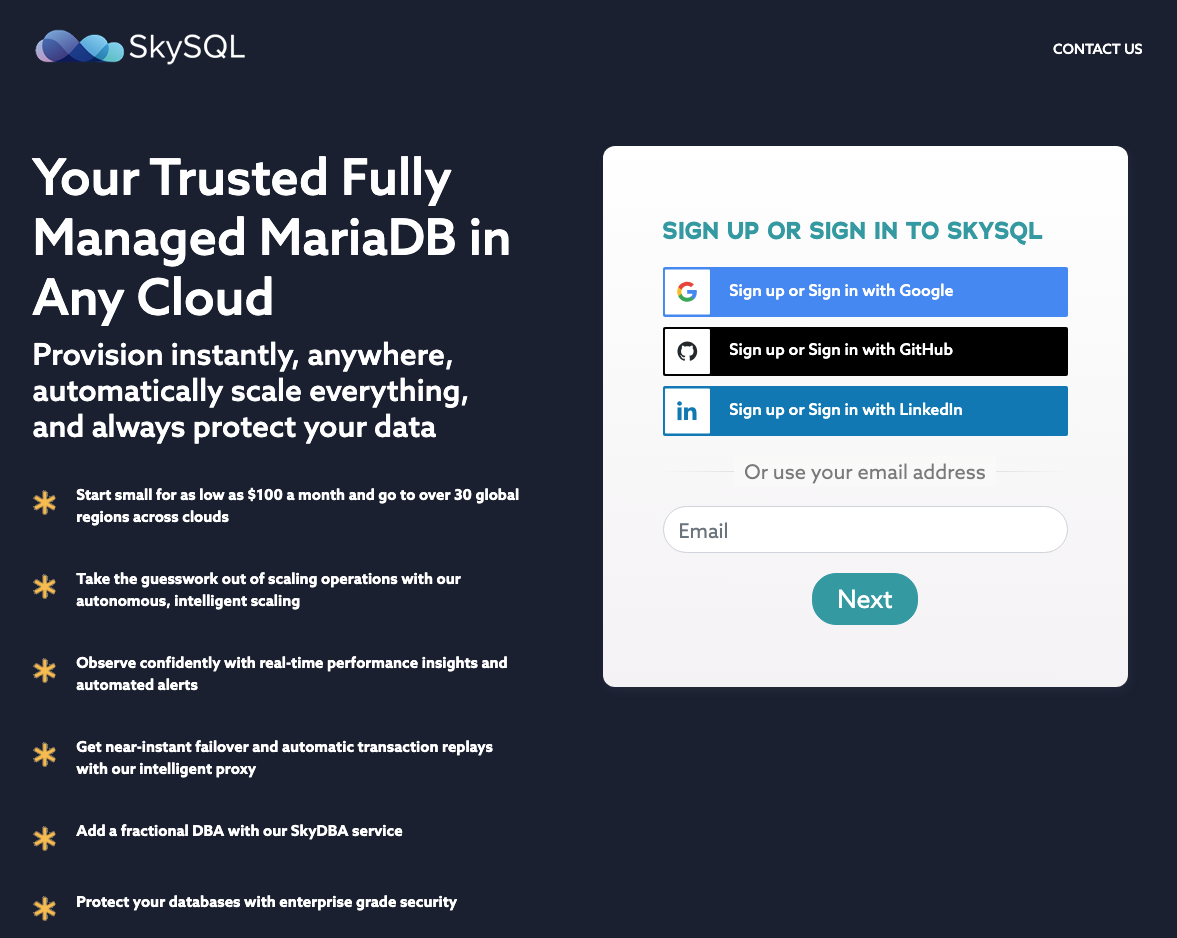
Step 1: Register for SkySQL
Goto app.skysql.com to sign up. You can sign up using your Google, Github or LinkedIn credentials. Or, just use your Email address to sign up.
Step 2: Launch a Service
- Log in to the SkySQL Portal and from the Dashboard, click the "+ Launch a Service" button.
Log in to the SkySQL Portal with your MariaDB ID and launch a service.
-
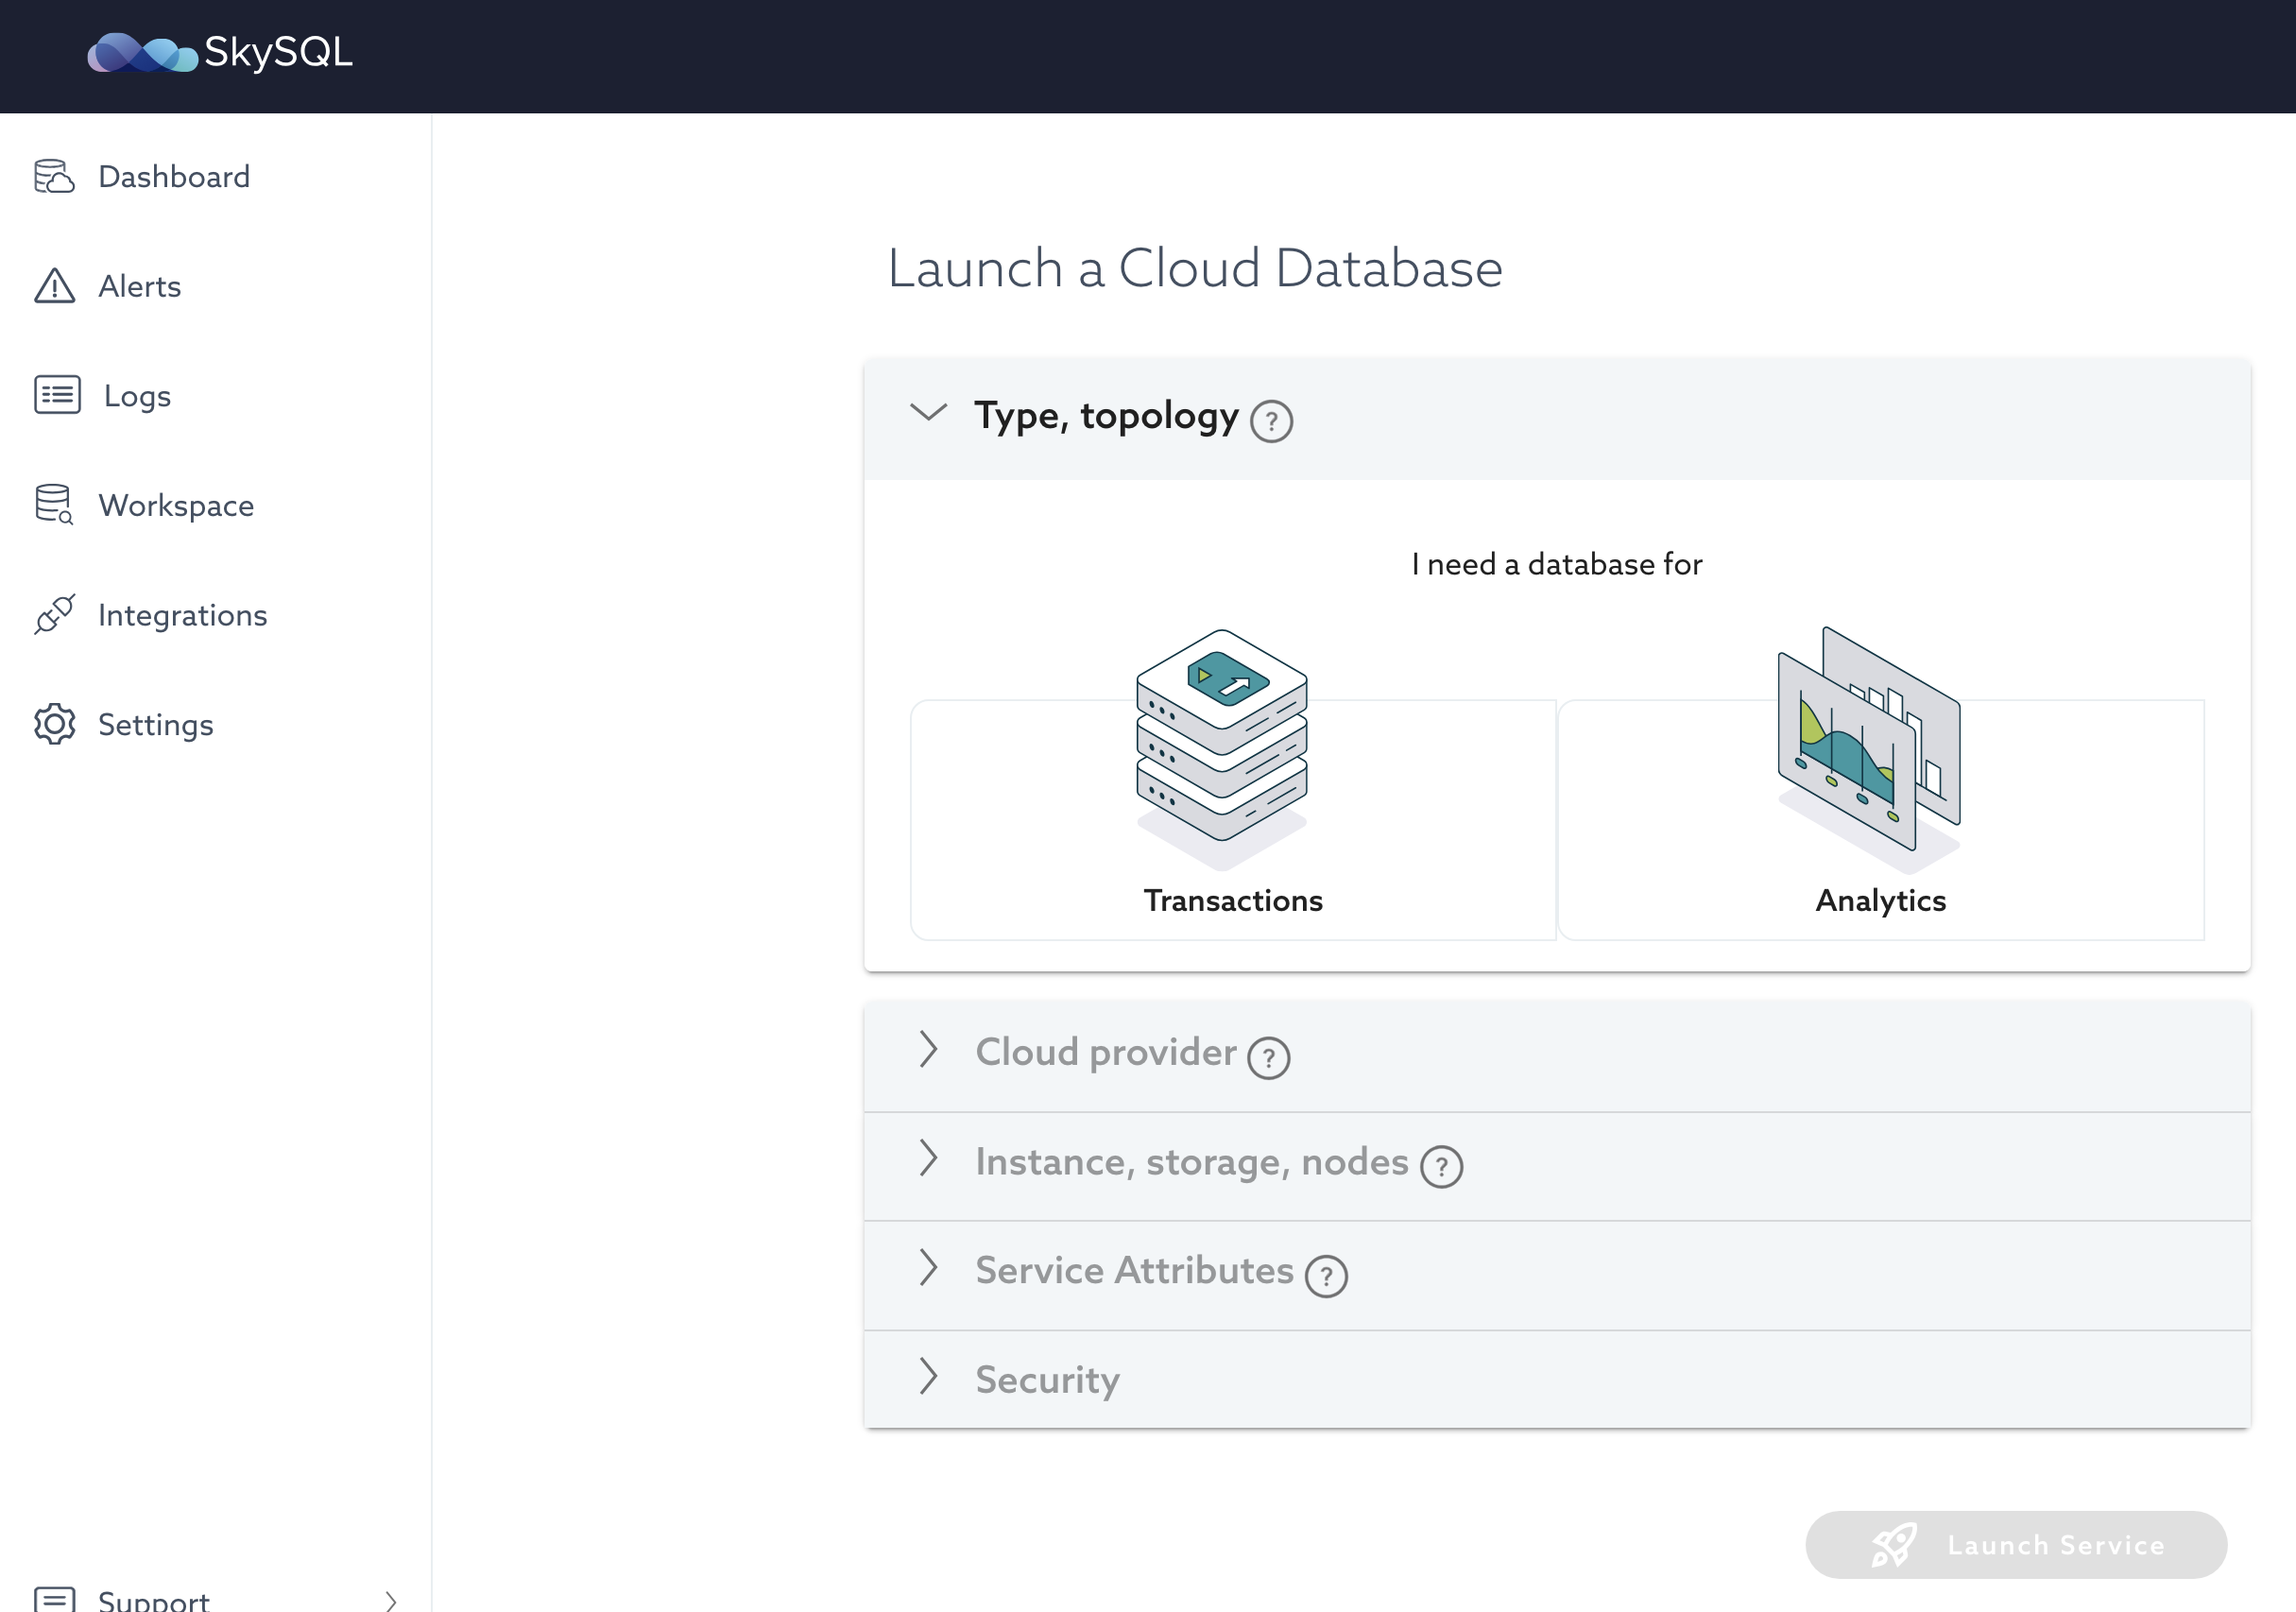
From the launch interface, select the type of service you want to launch.
Click the configuration choices detailed below.
https://app.skysql.com/launch-service
Select:
- Transactions and then ‘Enterprise Service with Replicas’
- AWS and
us-east-2, or Google Cloud andus-east1, or a region of your choice - Since this Quickstart is a simple test, select:
- The smallest instance size
- 100GB of SSD storage
- Name the service "
quickstart-1 -
Then, click the "LAUNCH SERVICE" button.

For additional information on available selections, see "Service Launch".
-
You will be returned to the Dashboard where your service will be in a "Creating" state.
When the service reaches "Healthy" state, go to the next step. It typically takes about 5 mins or less to launch a new DB.
Step 3: Try SQL using the built-in SQL Editor
Query Editor
SkySQL services support most MariaDB-compatible database clients and most popular programming languages (such as Python, Node.js, Java, and PHP).
However, with SkySQL's Query Editor, we can query databases directly from the web browser. This can be handy for development and day-to-day operations.
To access the Query Editor:
- From the Dashboard, click the "Workspace" link in the main menu (left navigation).
- Click the "Explore" link on the "Query Editor" card.
-
You may be prompted to add your IP address to the Firewall allowlist. Your service will enter a "Modifying" state while that change is performed.
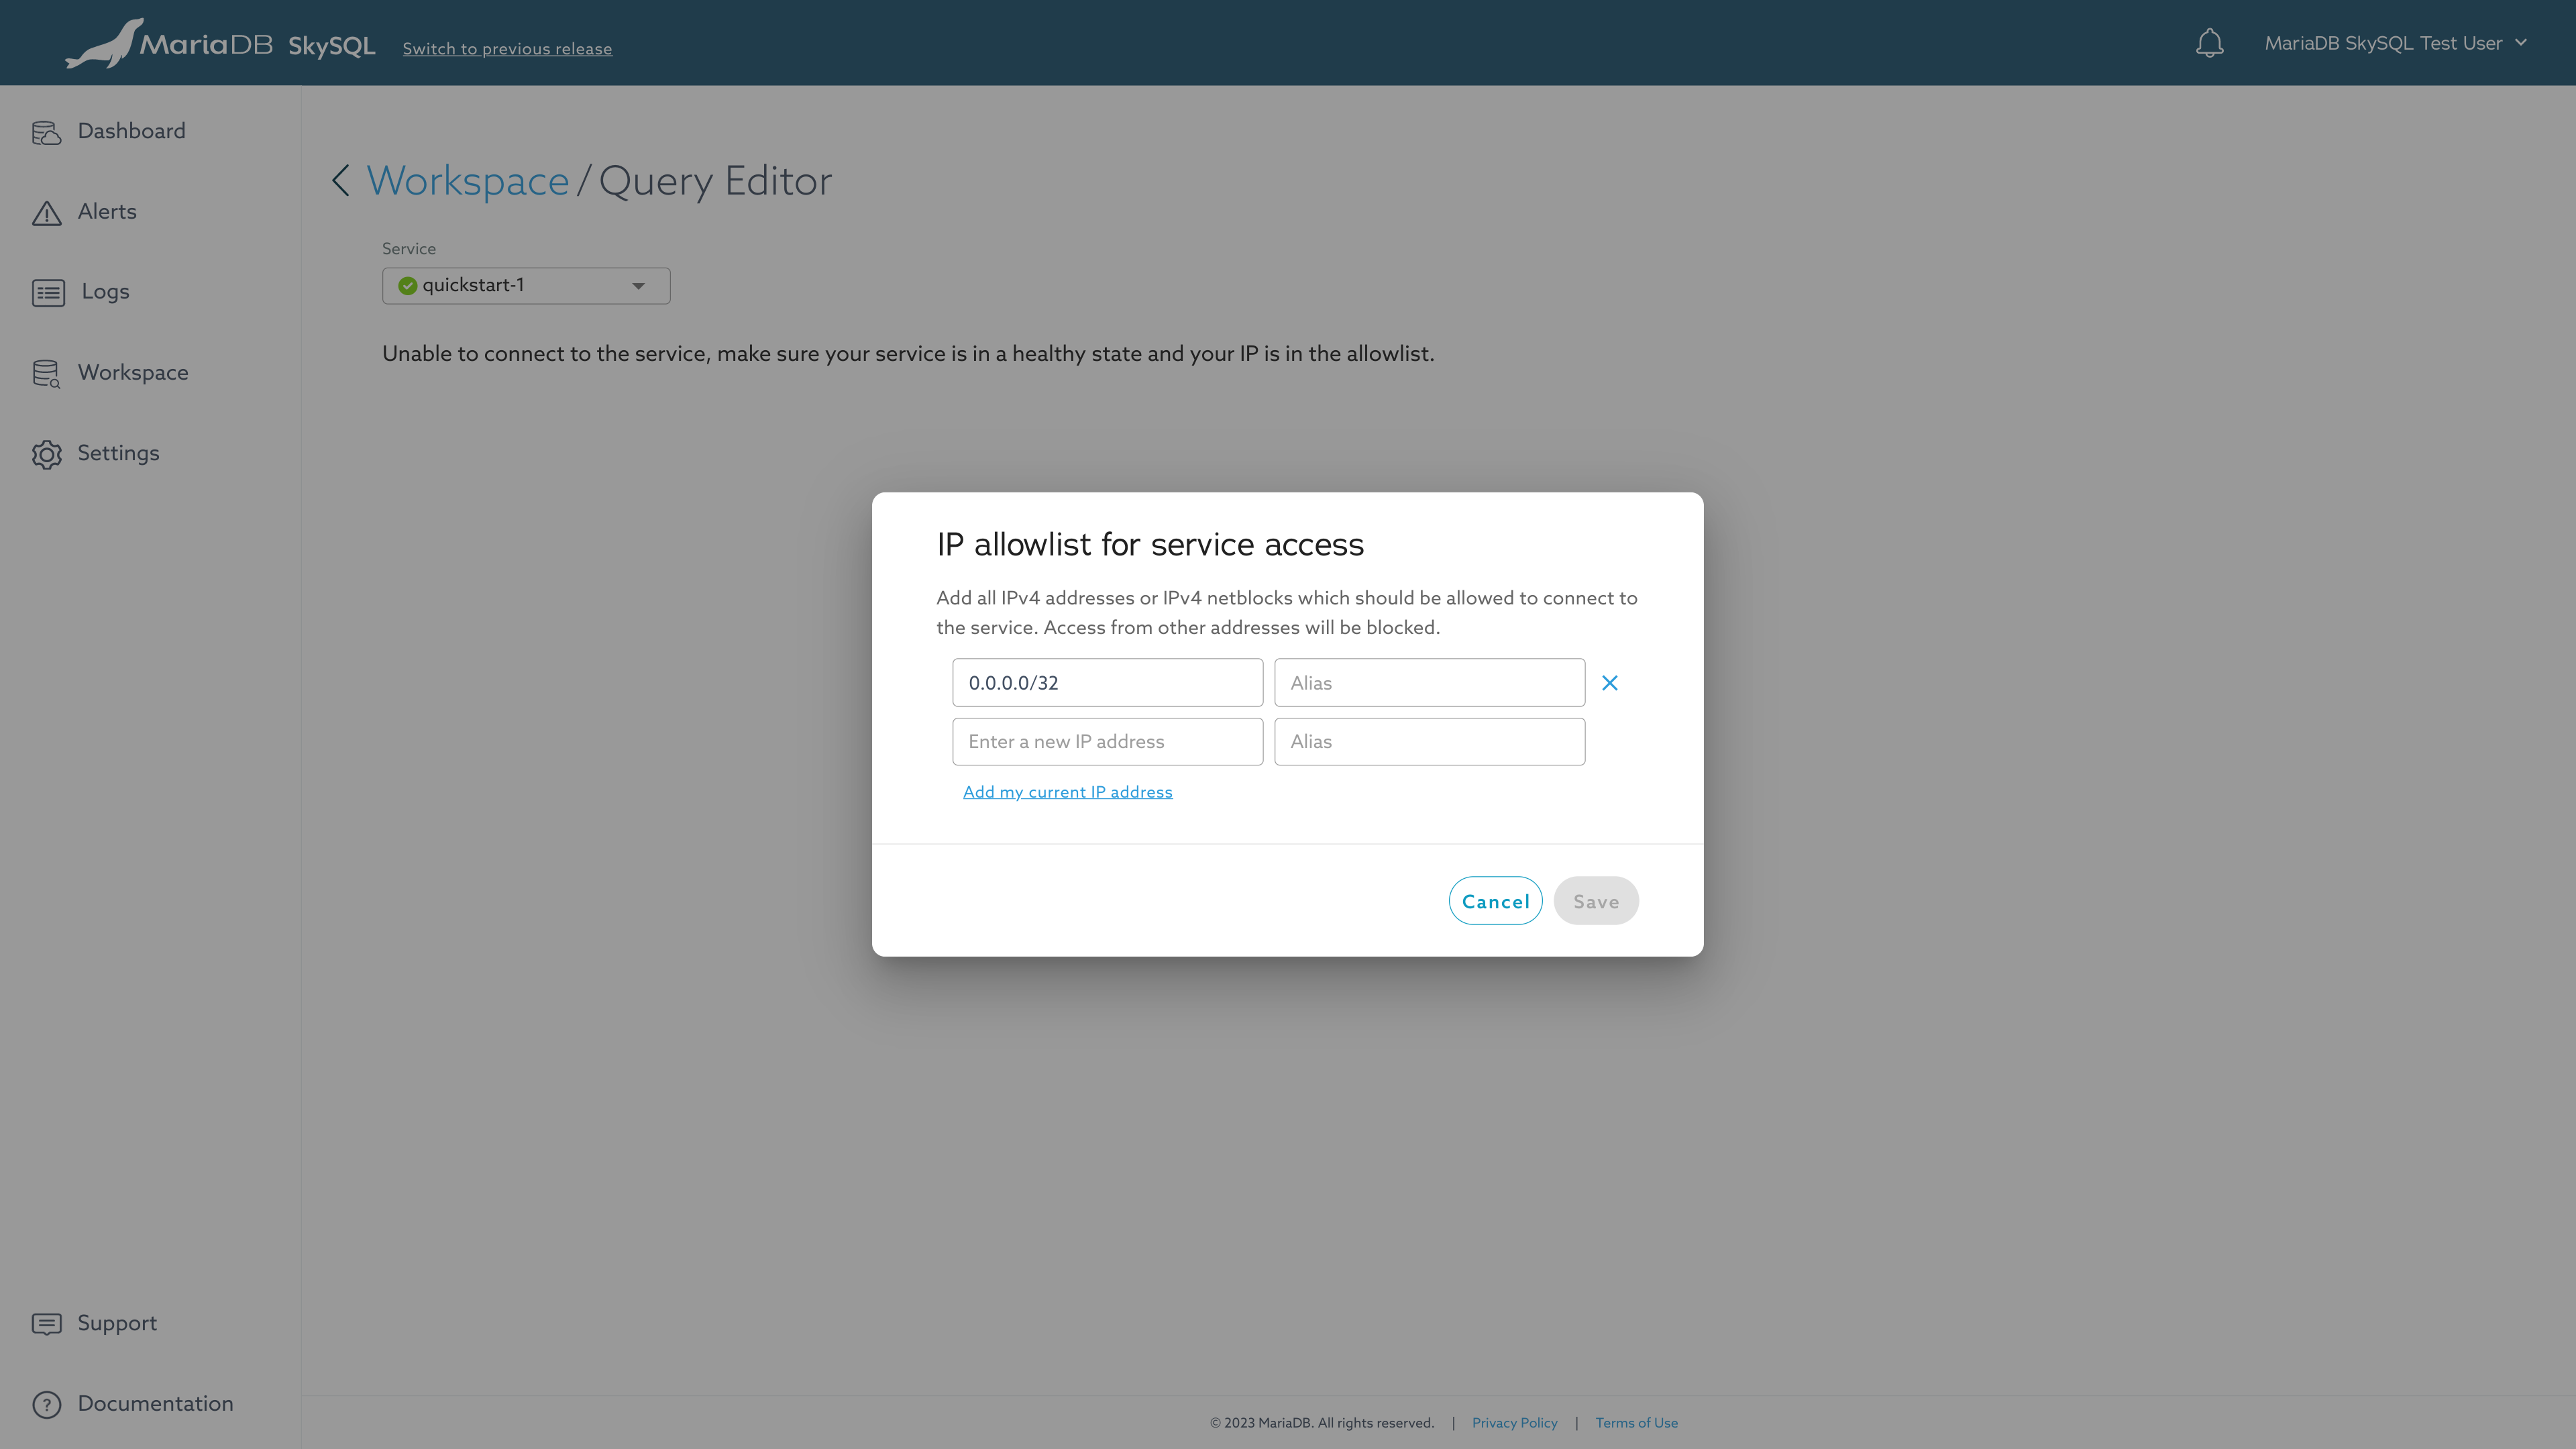
Query Editor - Allowlist
-
Once the Firewall update is completed, you can select your database in Query Editor.
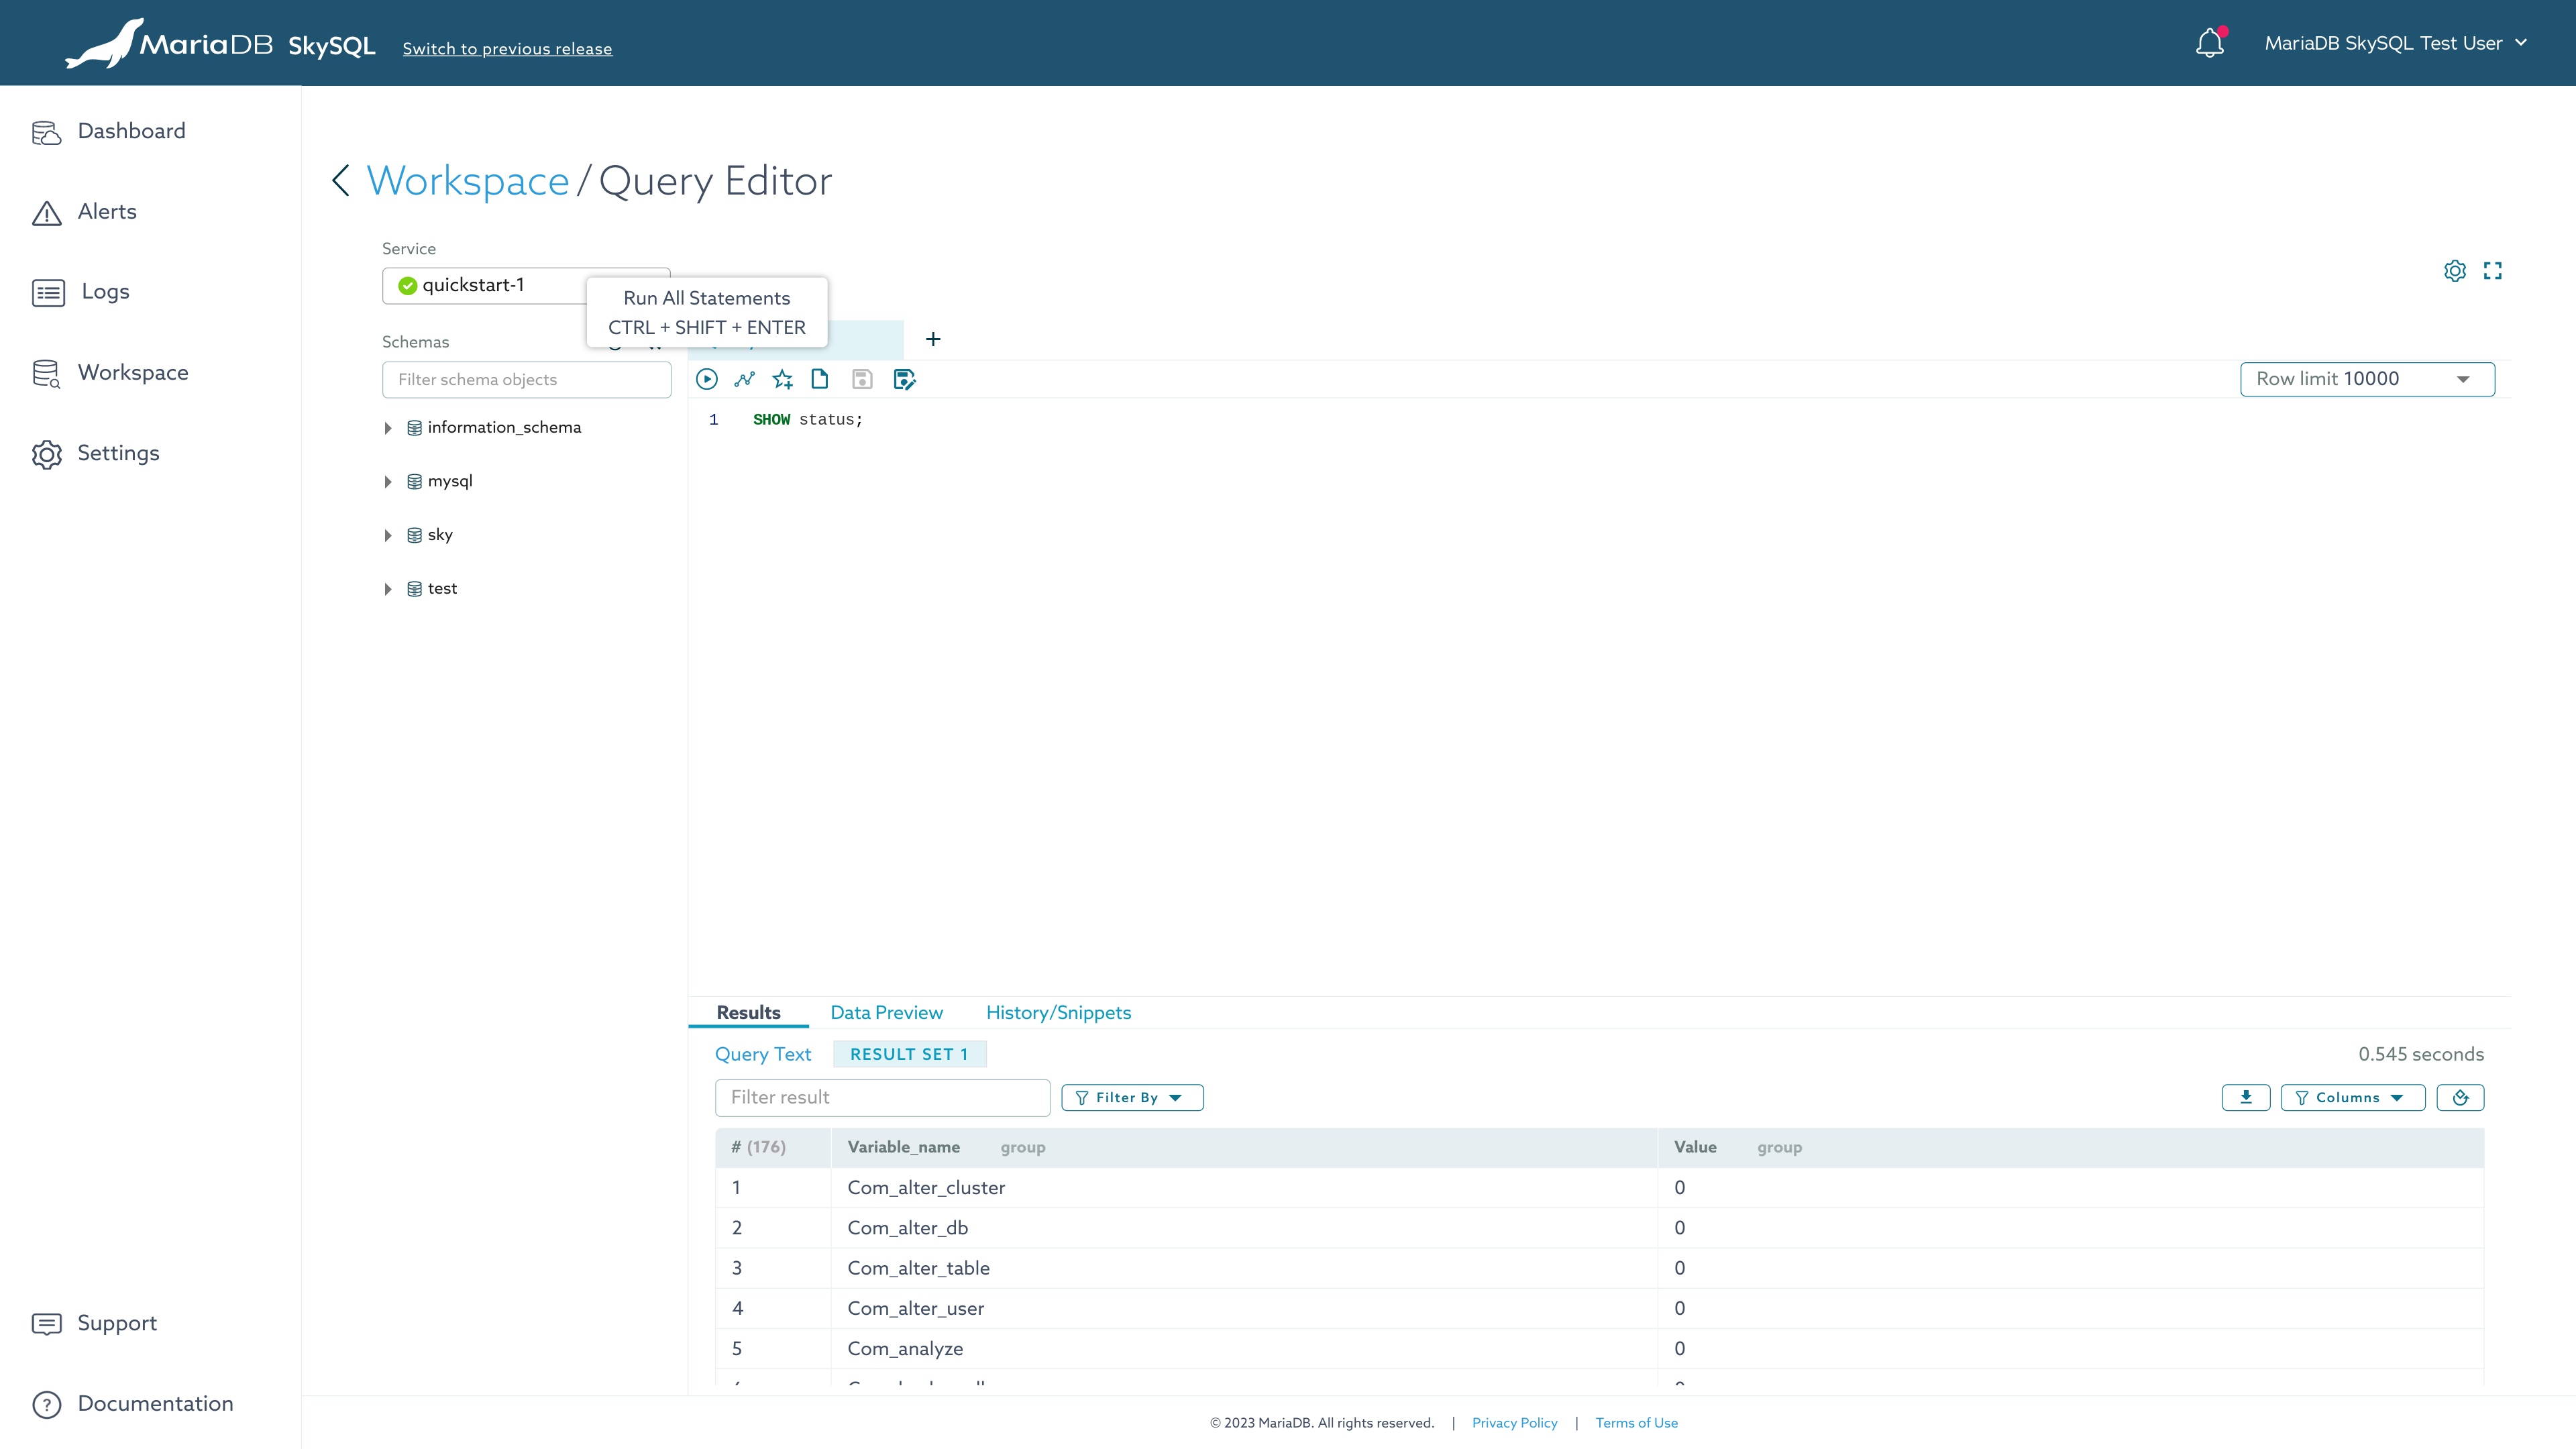
Query Editor
For additional information on this feature, see "Query Editor".
Step 4: Observe, Scale
Monitoring
You can monitor all the important database and OS metrics from the dashboard. The monitoring UI also allows you to view,download any/all logs - error, info or Audit logs.
Basic status is shown on the Dashboard.
To see expanded status and metrics information:
- From the Dashboard, click on the service name. (This is "quickstart-1" if you used the suggested name.)
- From the Monitoring Dashboard, you can choose to view service ("SERVICE OVERVIEW") or server ("SERVERS") details from the left tabs.
-
Specific views are provided for different sets of metrics. These views can be accessed using the buttons in the upper-right corner. From the service overview, views include "Status", "Queries", and "Connections".
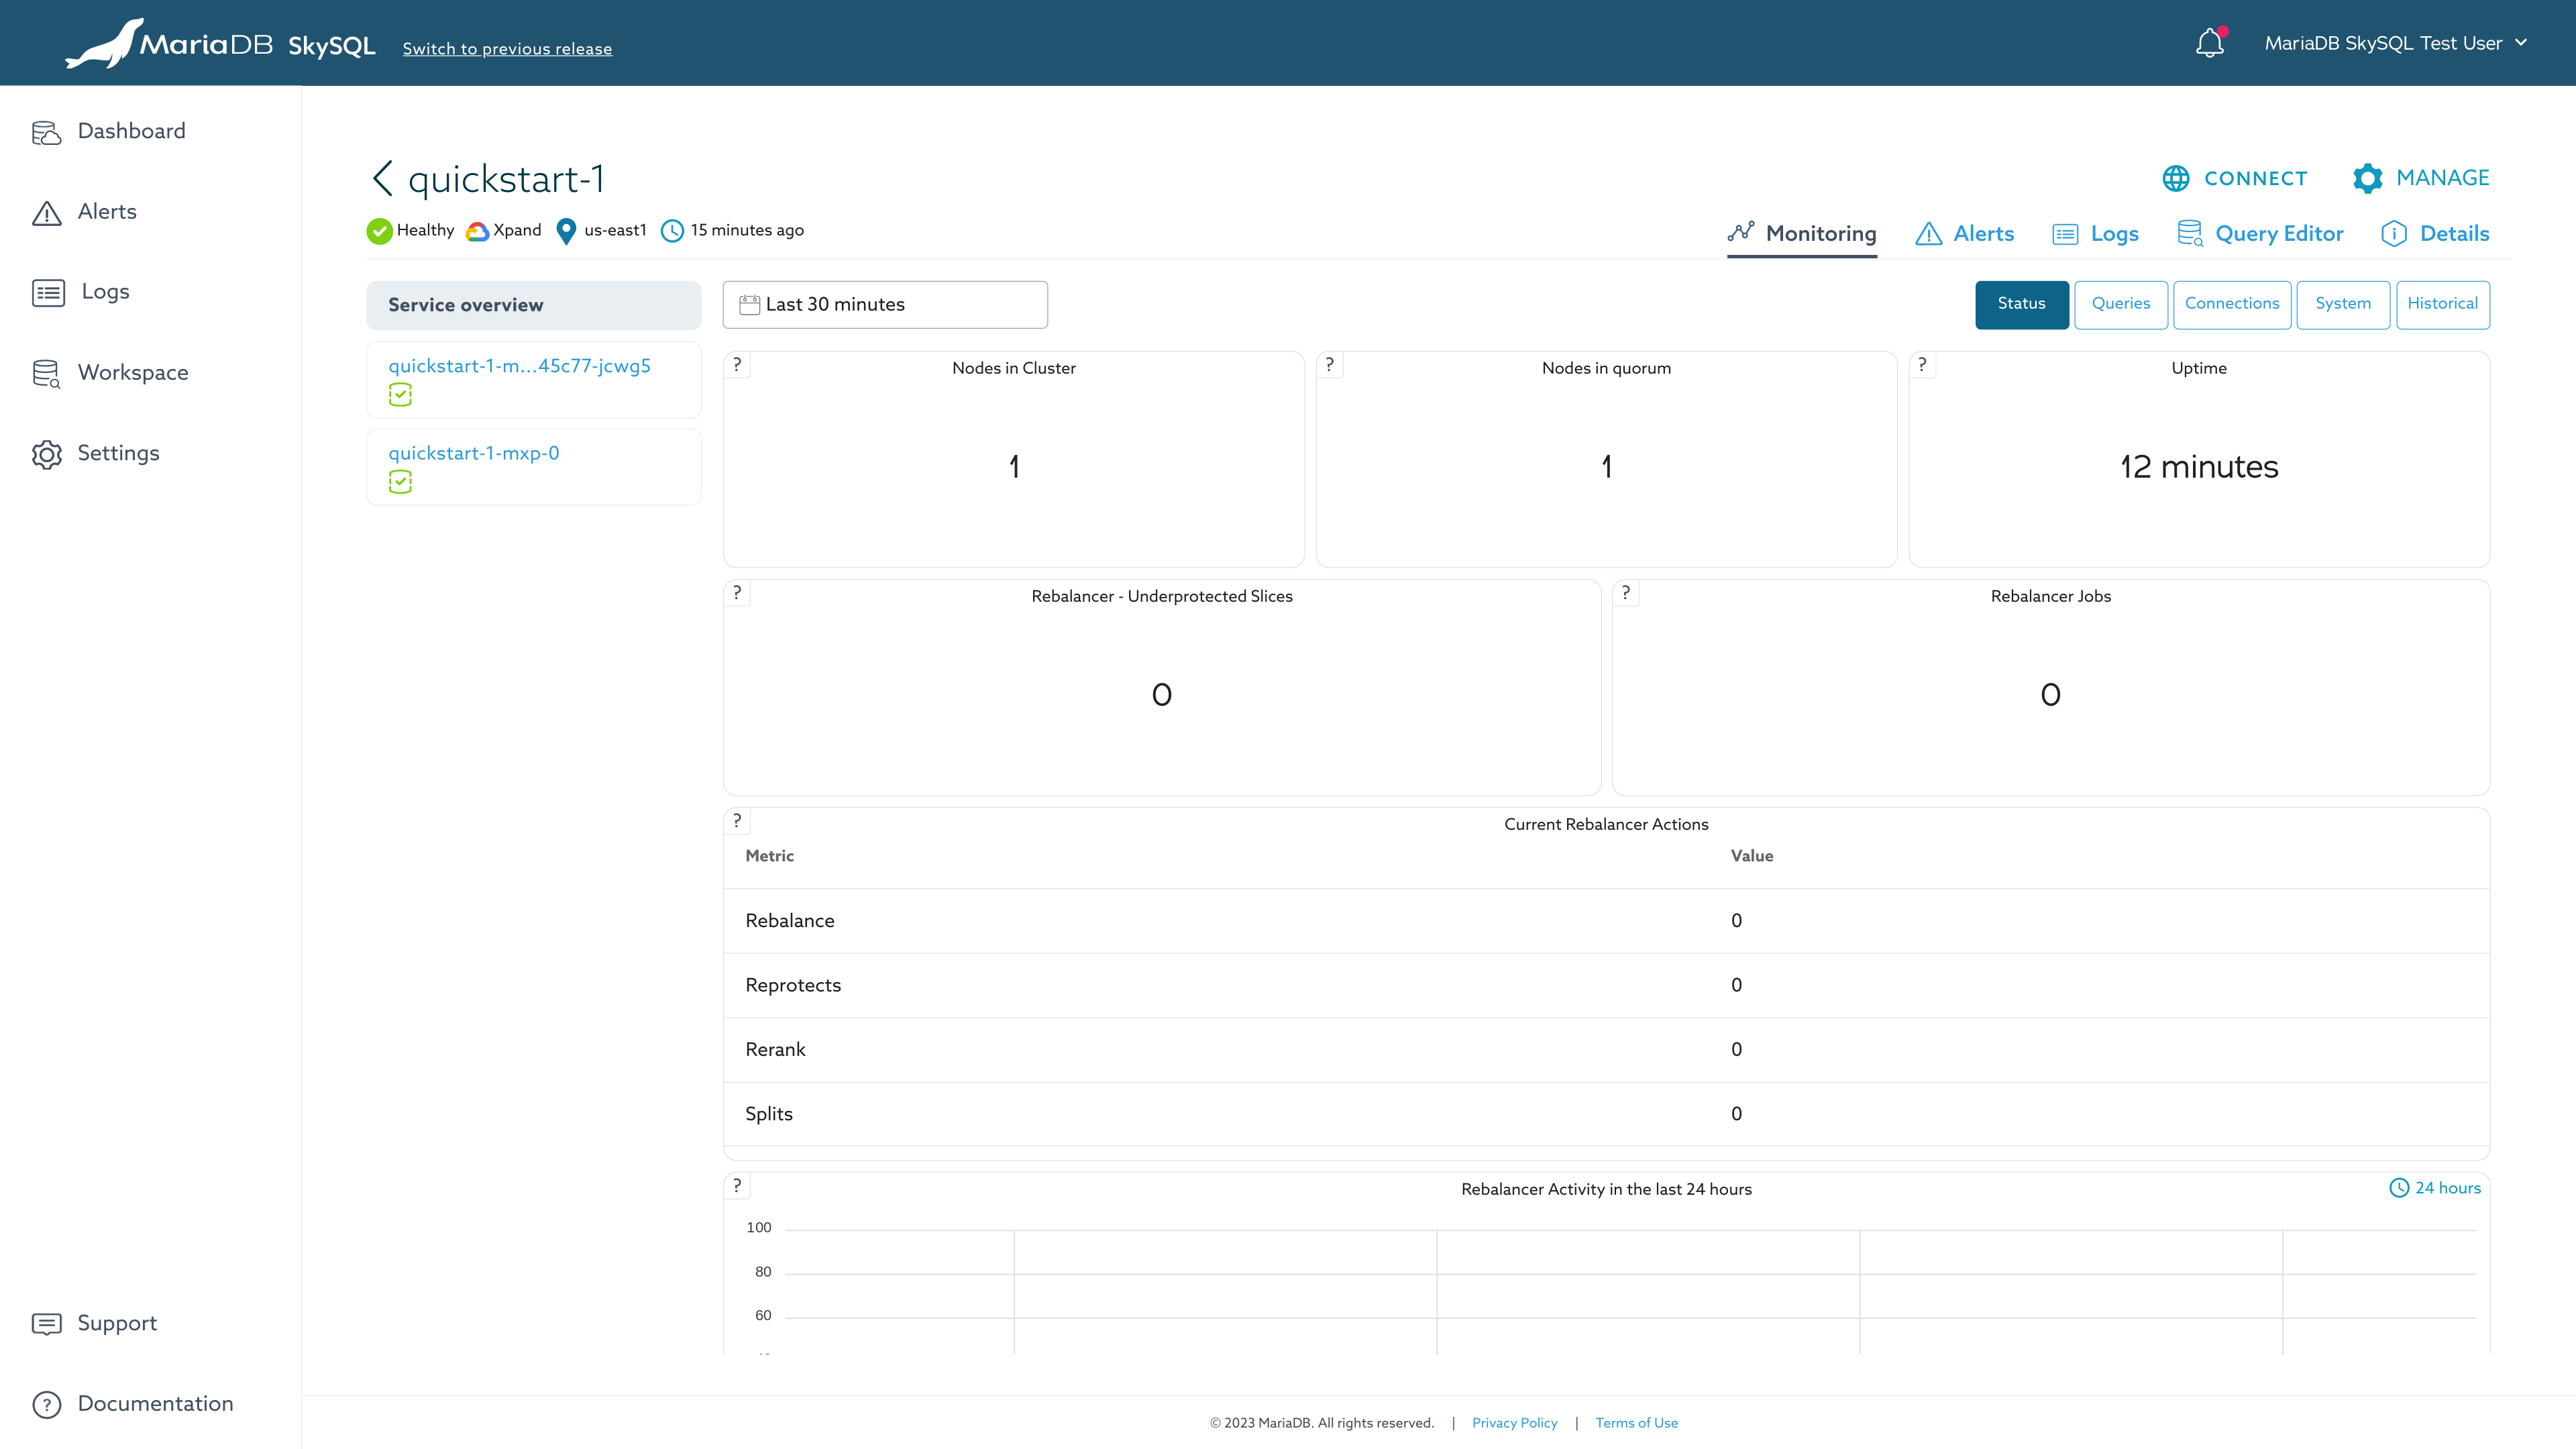
Monitoring Dashboard
Policies (alerting rules) identify "warning" and "critical" events within status and metrics data. Alerts are customer configurable, but pre-configured with sensible defaults in alignment to typical customer requirements. For additional information, see "Alerts".
Scaling
SkySQL features automatic rule-based scaling (Autonomous) and manual on-demand scaling.
With automatic scaling, node count (horizontal) and node count (vertical) changes can be triggered based on load. Additionally, storage capacity expansion can be triggered based on usage. These Autonomous features are opt-in. For additional information, see "Autonomous".

Autonomous
https://app.skysql.com/
With manual scaling, you can perform horizontal scaling (In/Out), vertical scaling (Up/Down), and storage expansion on-demand using Self-Service Operations. For additional information, see "Self-Service Operations".
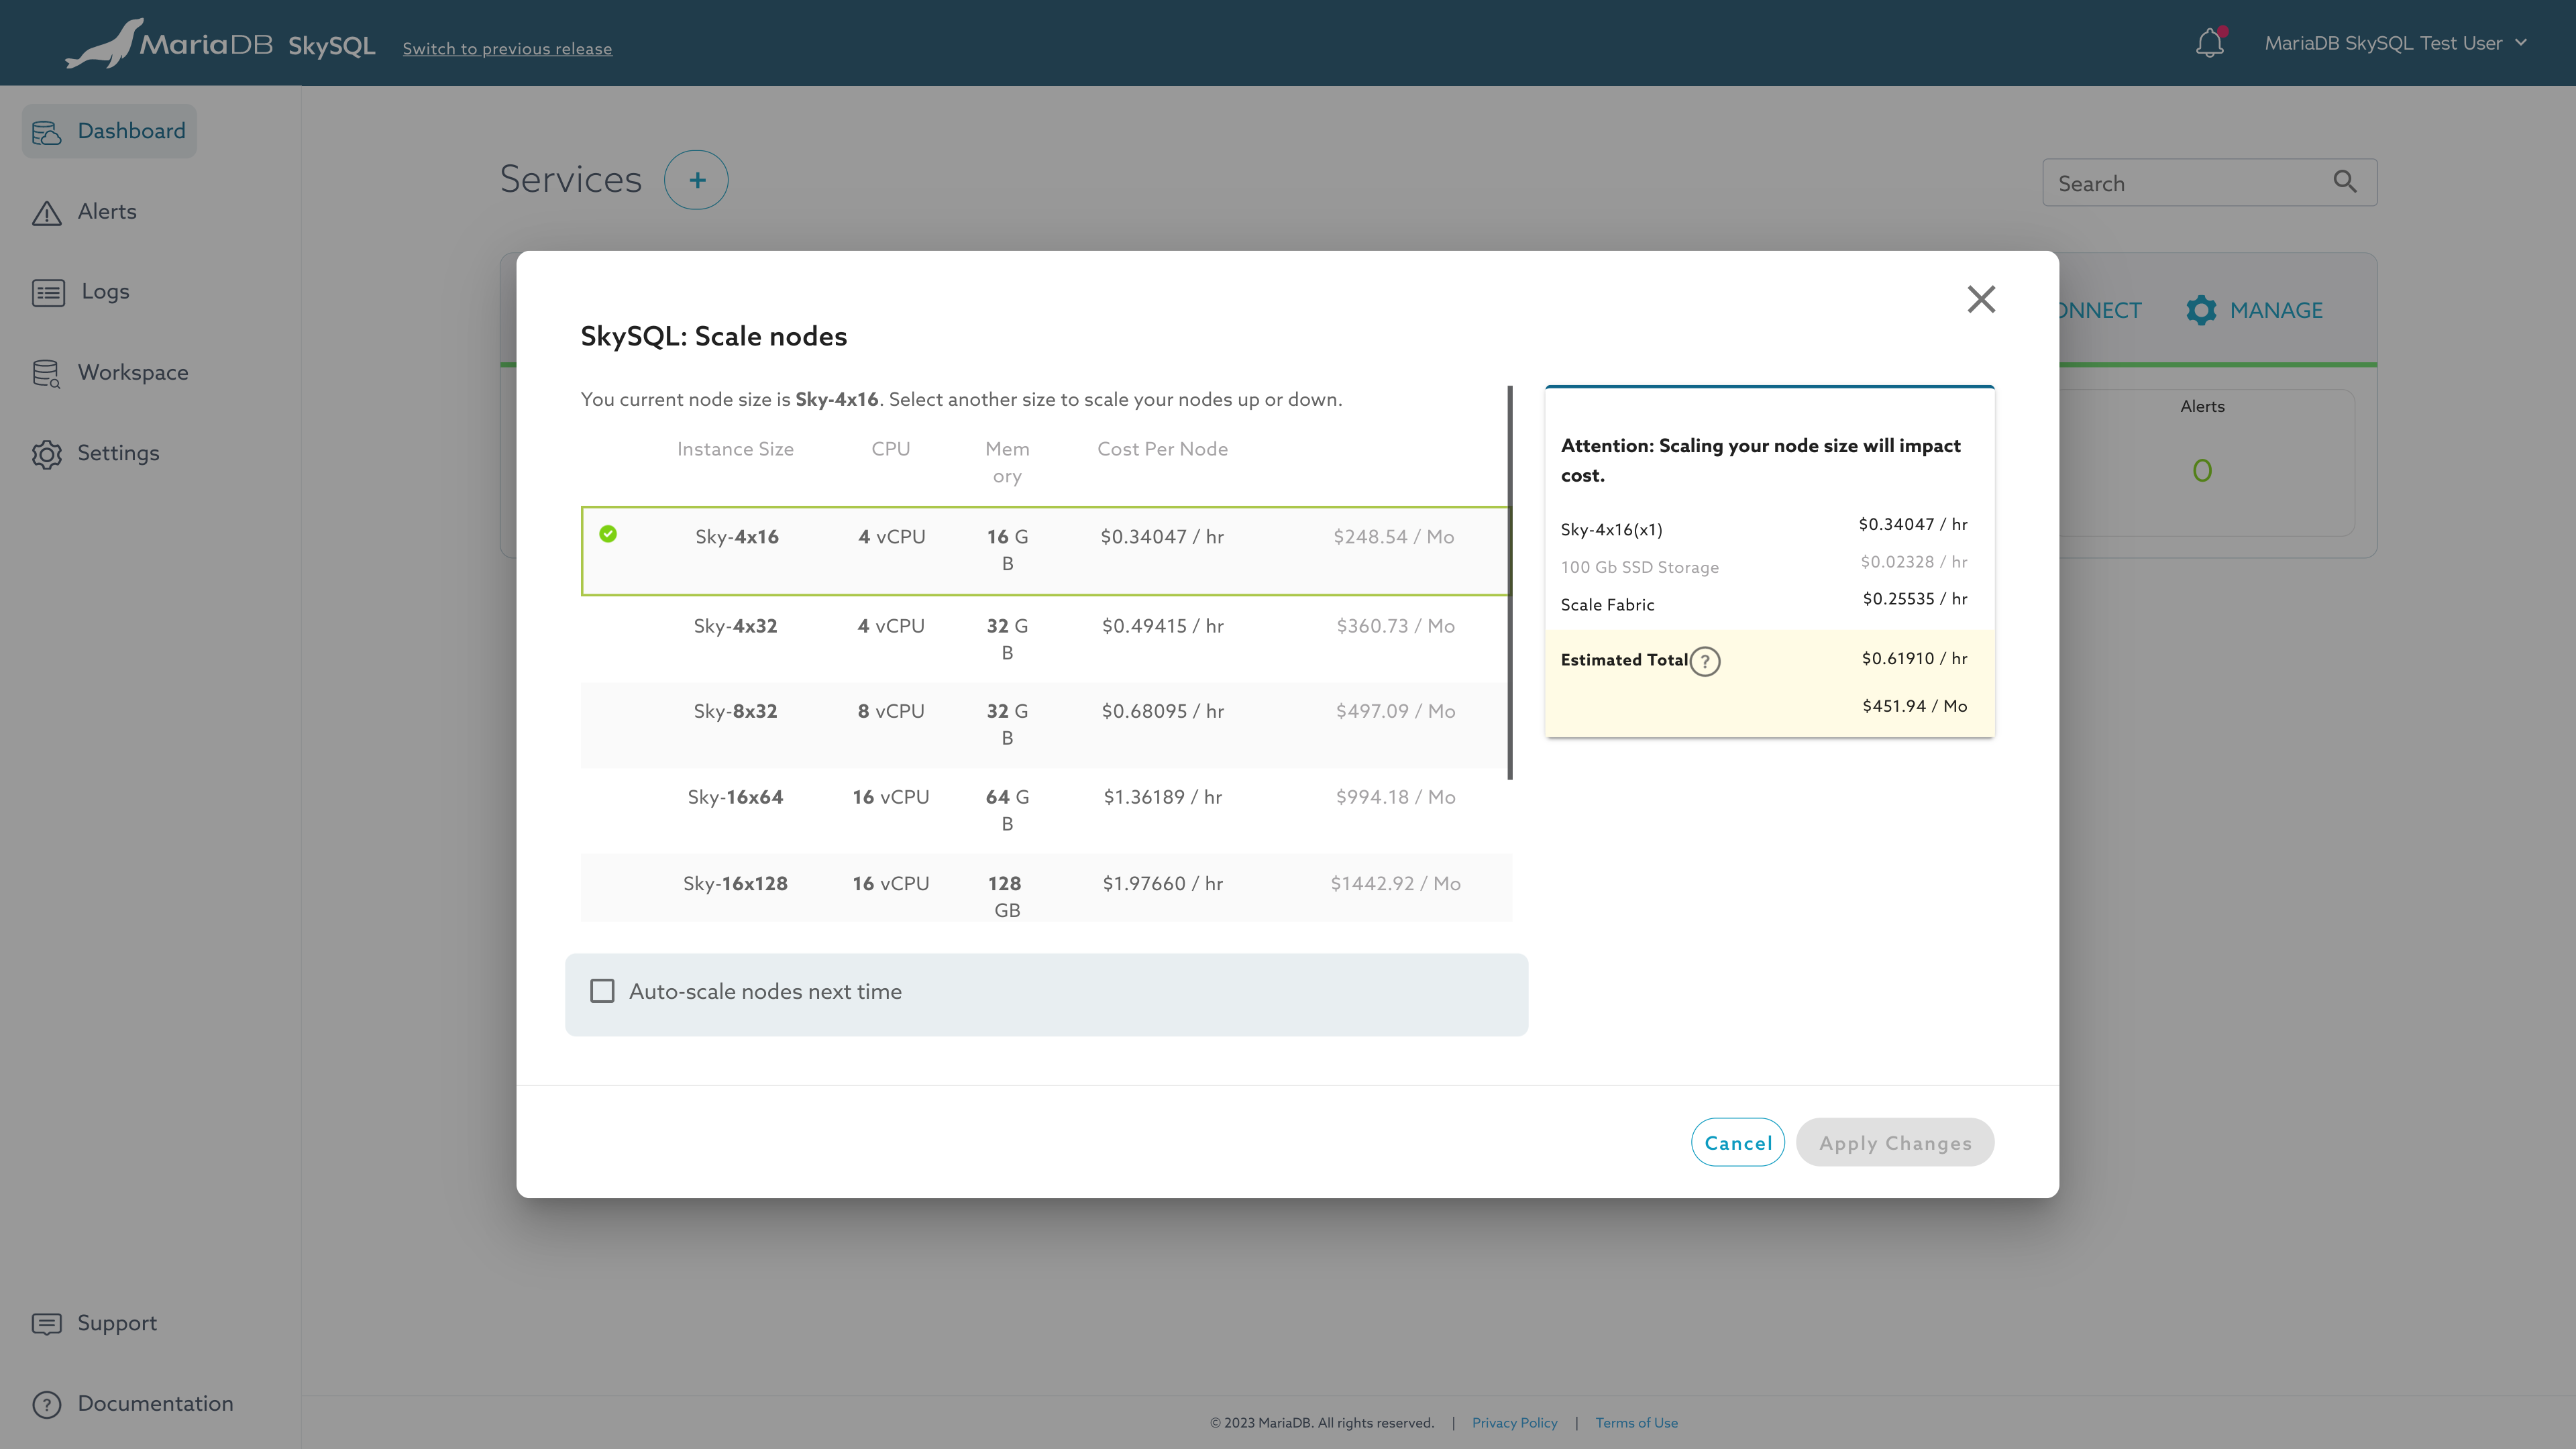
Self-Service Scaling of Nodes
Step 5: Tear-down
When you are done with your testing session, you can stop the service. When a service is stopped, storage charges continue to accrue, but compute charges pause until the service is started again.
When you are done with testing, you can delete the service.
Stopping, starting, and deleting a service are examples of Self-Service Operations that you can perform through the Portal.
For additional information, see "Self-Service Operations".